Back to Product Cases Case Showcase / Petrochemical / Industrial SCADA

PetroOps Refinery Monitoring

A refinery demo for process flow, live instruments, prioritized alarms, trend drawers, and operator handling.

PetroOps refinery monitoring demo screenshot
Case Overview

From Qt Components to a Complete Product Workspace

PetroOps combines a P&ID-style process view, critical telemetry, alarm lists, and trend drawers into a refinery operations interface with a clear alarm-handling loop.

Dual views for dashboard and process flow
Alarm priority, acknowledgement, and detail drawer
Critical trends for temperature, pressure, and flow
Screens and Features

Case Page Showcase

Each section maps to a real demo screen and lists its purpose, main interactions, and Qt-UI controls.

Operations Dashboard - PetroOps Refinery Monitoring
01

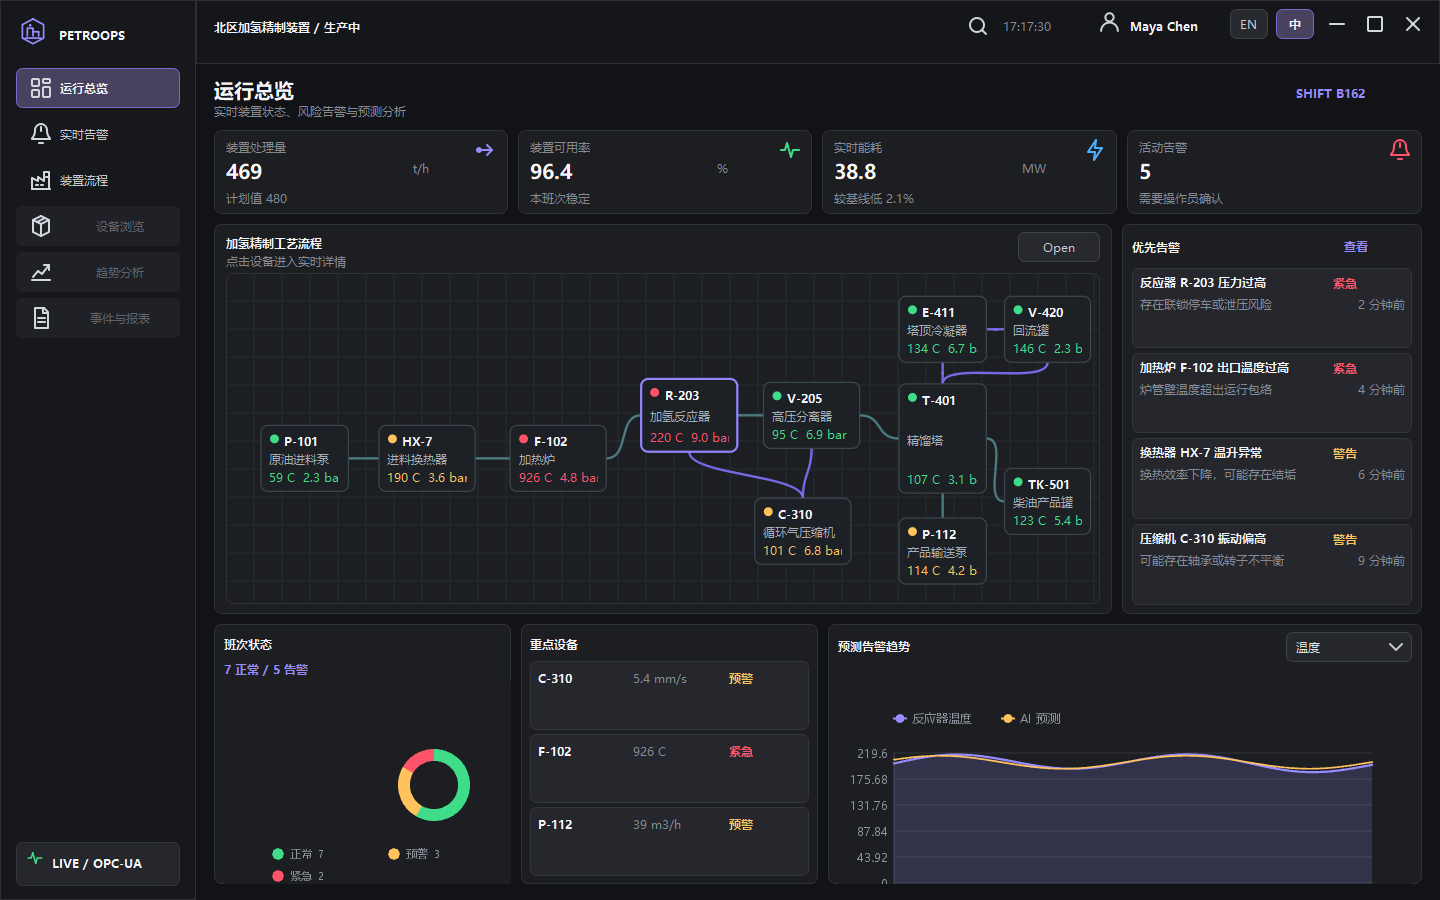
Operations Dashboard

Centralizes reactor, heat exchanger, pump, shift metrics, alarm count, and predictive trends for quick load assessment.

Interaction
Alarm entry points, process detail entry, and trend drawer are linked.
Controls Used
UIGQWindow UIGQContainer UIGQLabel UIGQPushButton UIGQLineChart UIGQOpenGLPieChart
Process Flow and Alarm Handling - PetroOps Refinery Monitoring
02

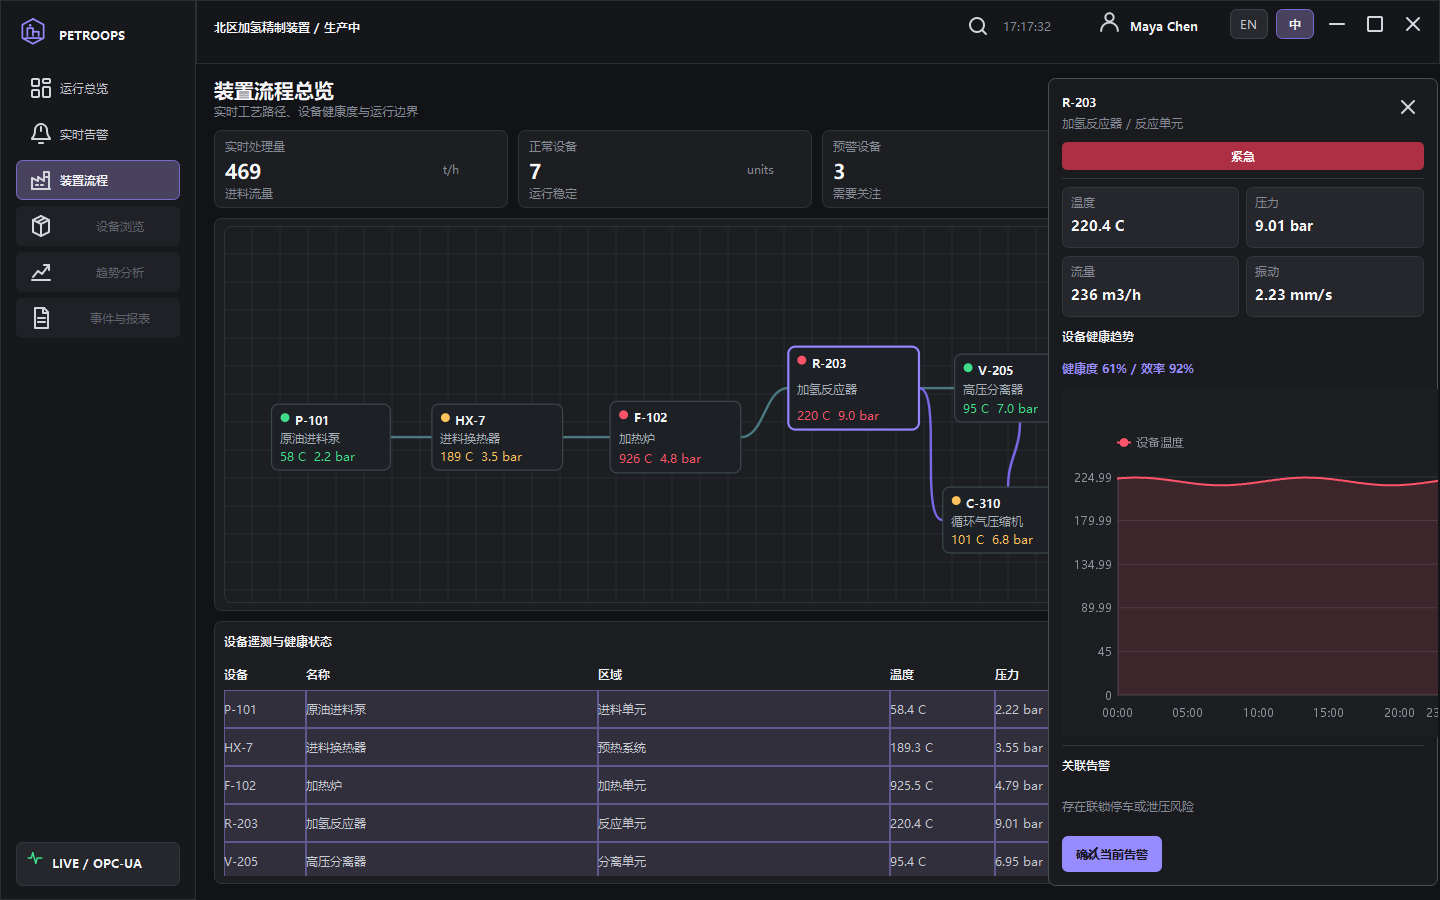
Process Flow and Alarm Handling

Shows pipelines, equipment, valves, and states in a process view, with drawer-based handling for high-priority alarms.

Interaction
Clicking alarms opens the plant view, and acknowledgement updates the state.
Controls Used
RefineryProcessView UIGQTableView UIGQPushButton UIGQContainer UIGQLabel