Screens and Features
Case Page Showcase
Each section maps to a real demo screen and lists its purpose, main interactions, and Qt-UI controls.
01
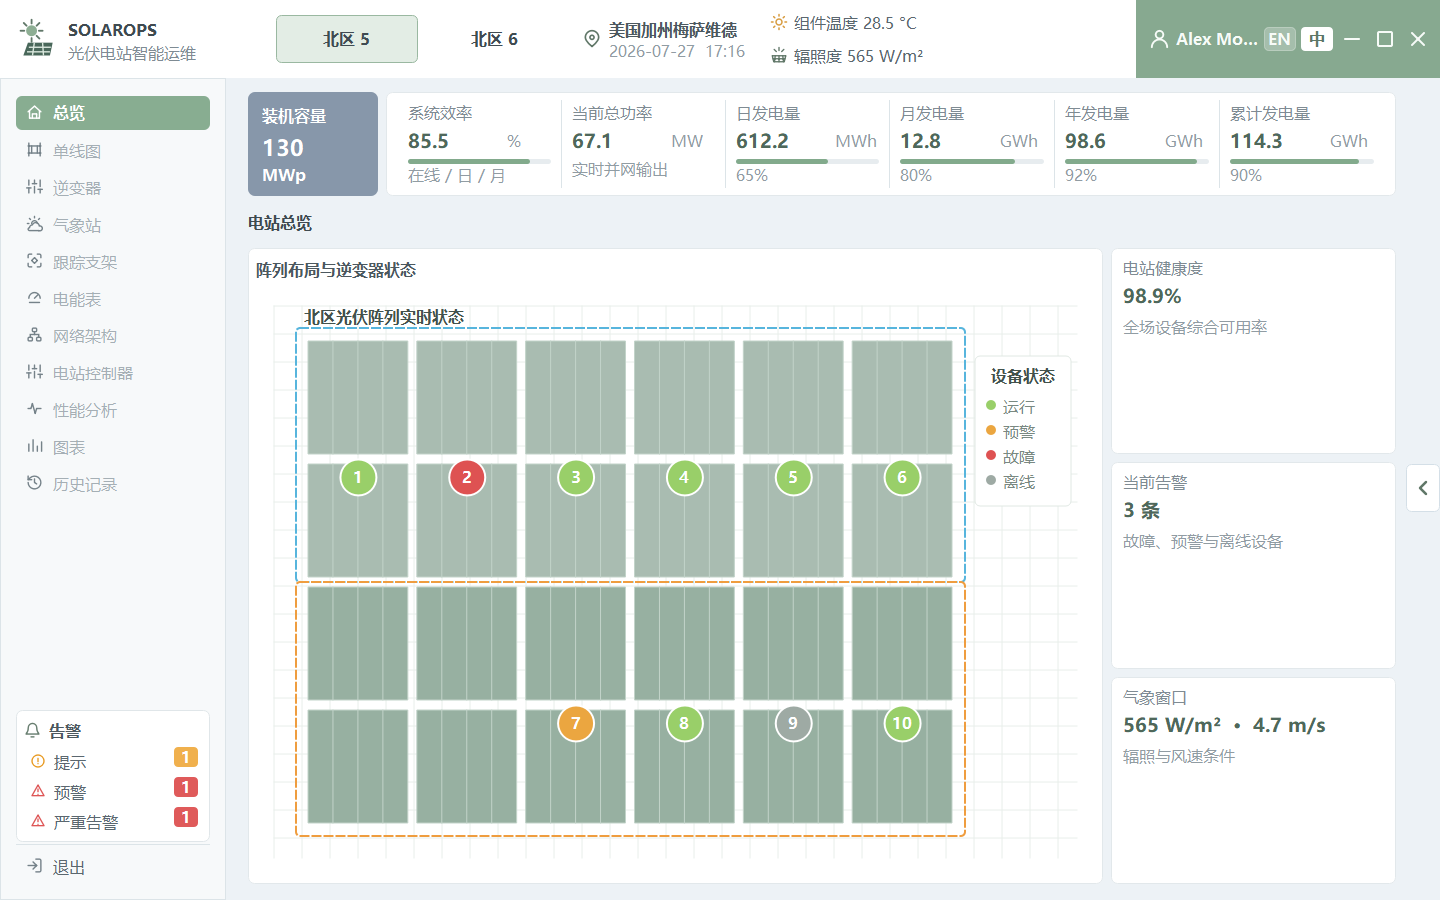
Plant Overview
Shows capacity, current power, daily energy, monthly/yearly totals, alarm count, and weather context for fast operational assessment.
Interaction
Site switching, alarm filtering, and live KPI refresh.
Controls Used
UIGQWindow
UIGQContainer
UIGQLabel
UIGQPushButton
UIGQProgressBar
02
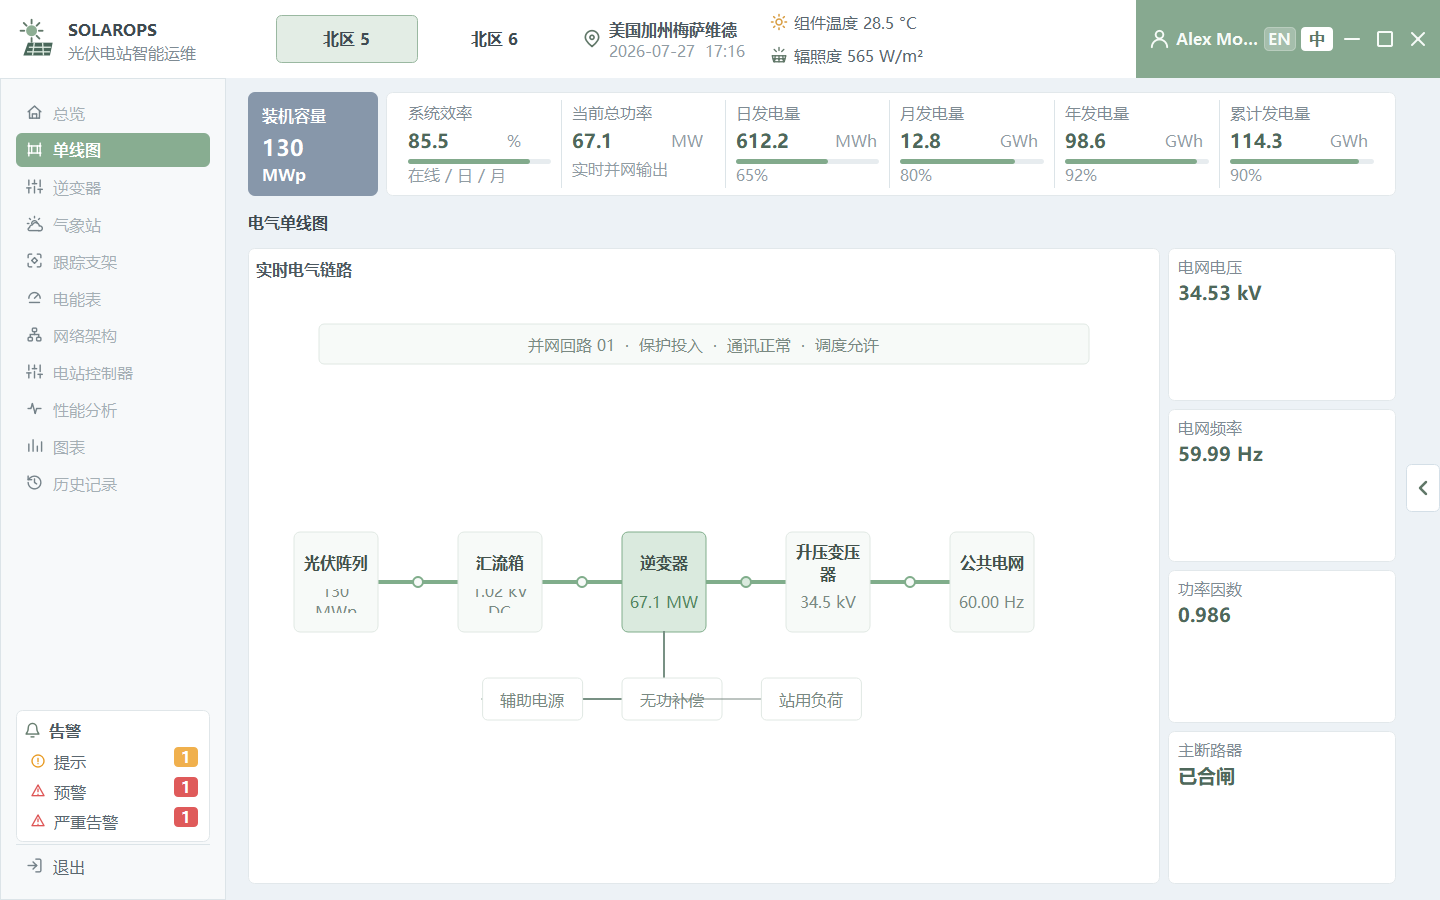
Single-line Diagram
Presents inverter, combiner, transformer, and grid connection topology for clear equipment status and power-flow visibility.
Interaction
Device states refresh with simulated telemetry and alarmed devices are highlighted.
Controls Used
UIGQContainer
UIGQLabel
SolarPlantDiagramWidget
03
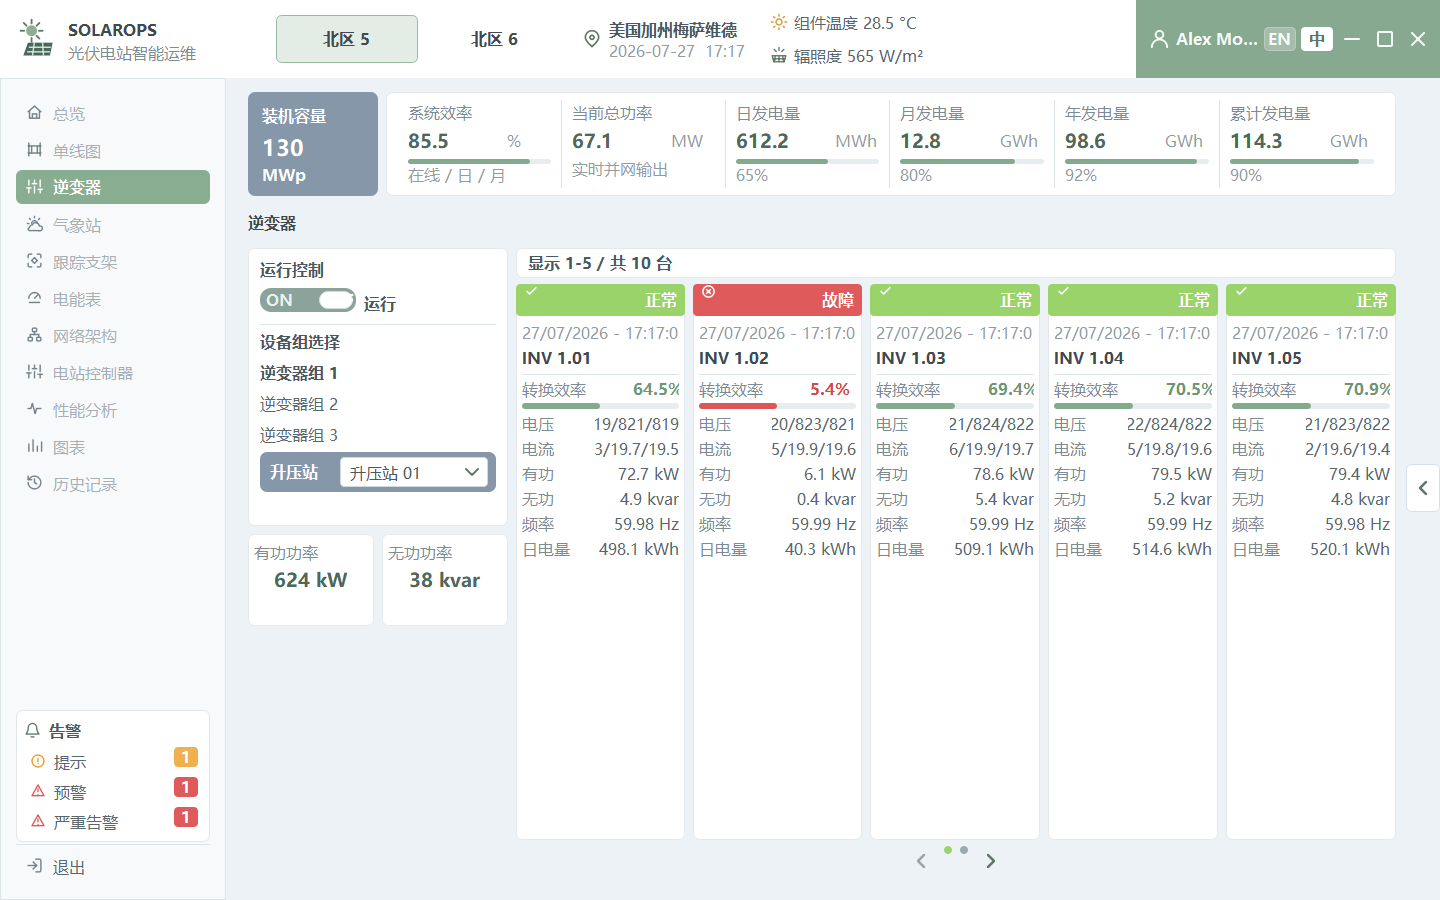
Inverter Monitoring
Uses paged cards to show inverter output, efficiency, temperature, status, and abnormalities by equipment group.
Interaction
Previous/next paging, group switching, and card state refresh.
Controls Used
UIGQContainer
UIGQPushButton
UIGQRadioButton
InverterCard
04
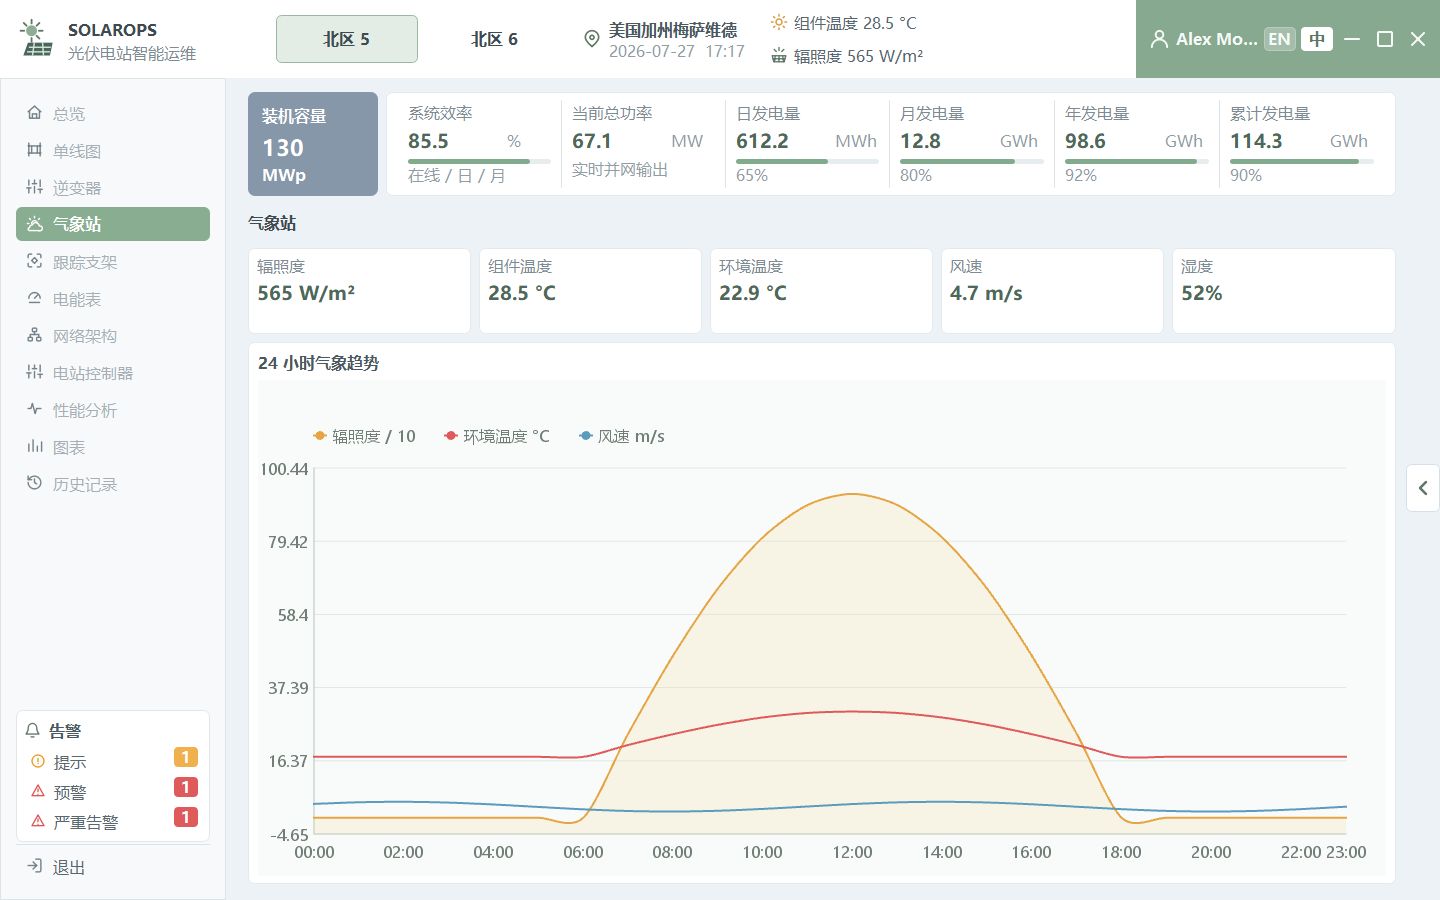
Weather Station
Shows irradiance, temperature, wind speed, and weather trends to understand environmental impact on generation efficiency.
Interaction
Metric cards and trend curves update together.
Controls Used
UIGQContainer
UIGQLabel
UIGQLineChart
05
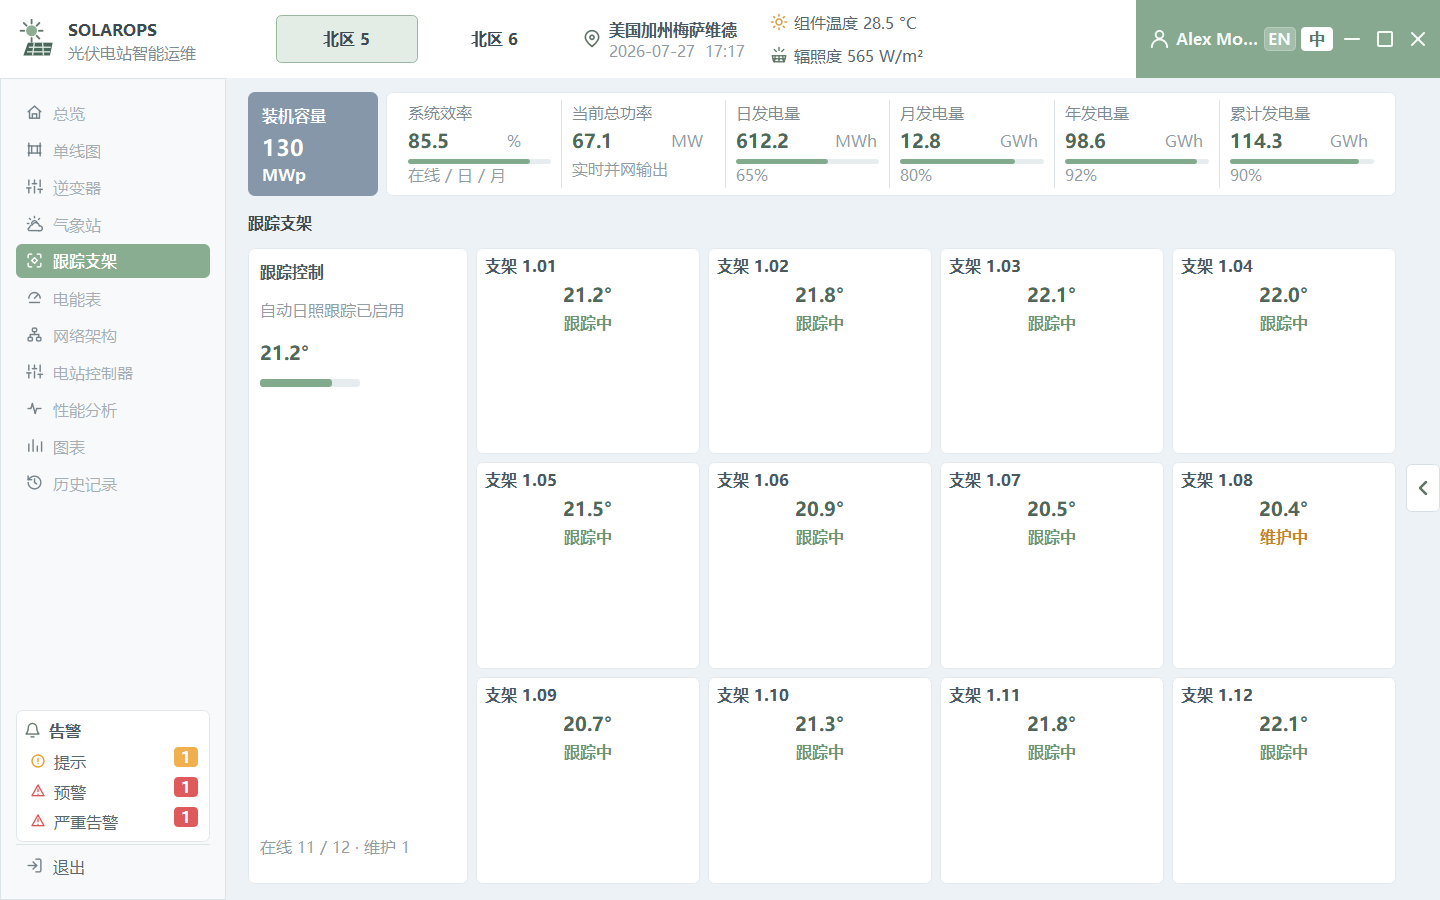
Trackers
Shows tracker angle, sync state, and abnormal counts for monitoring mechanical tracking quality.
Interaction
Status cards, progress bars, and alarm colors communicate equipment health.
Controls Used
UIGQContainer
UIGQLabel
UIGQProgressBar
06
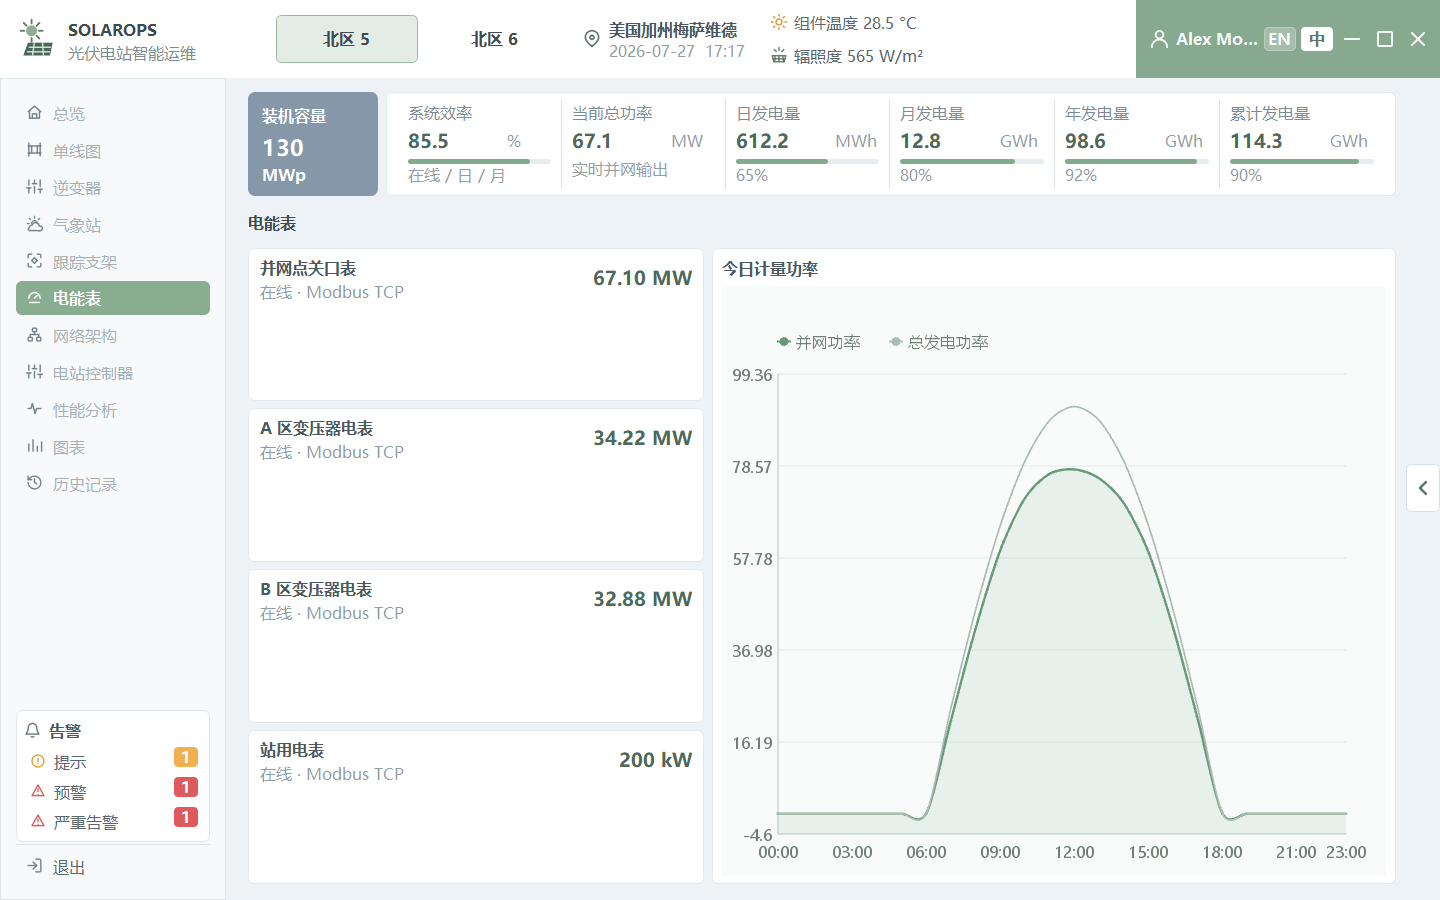
Meters
Centralizes meter readings, power factor, and metering trends for energy accounting and diagnostics.
Interaction
Meter KPIs and curves are linked for time-period comparison.
Controls Used
UIGQContainer
UIGQLabel
UIGQLineChart
07
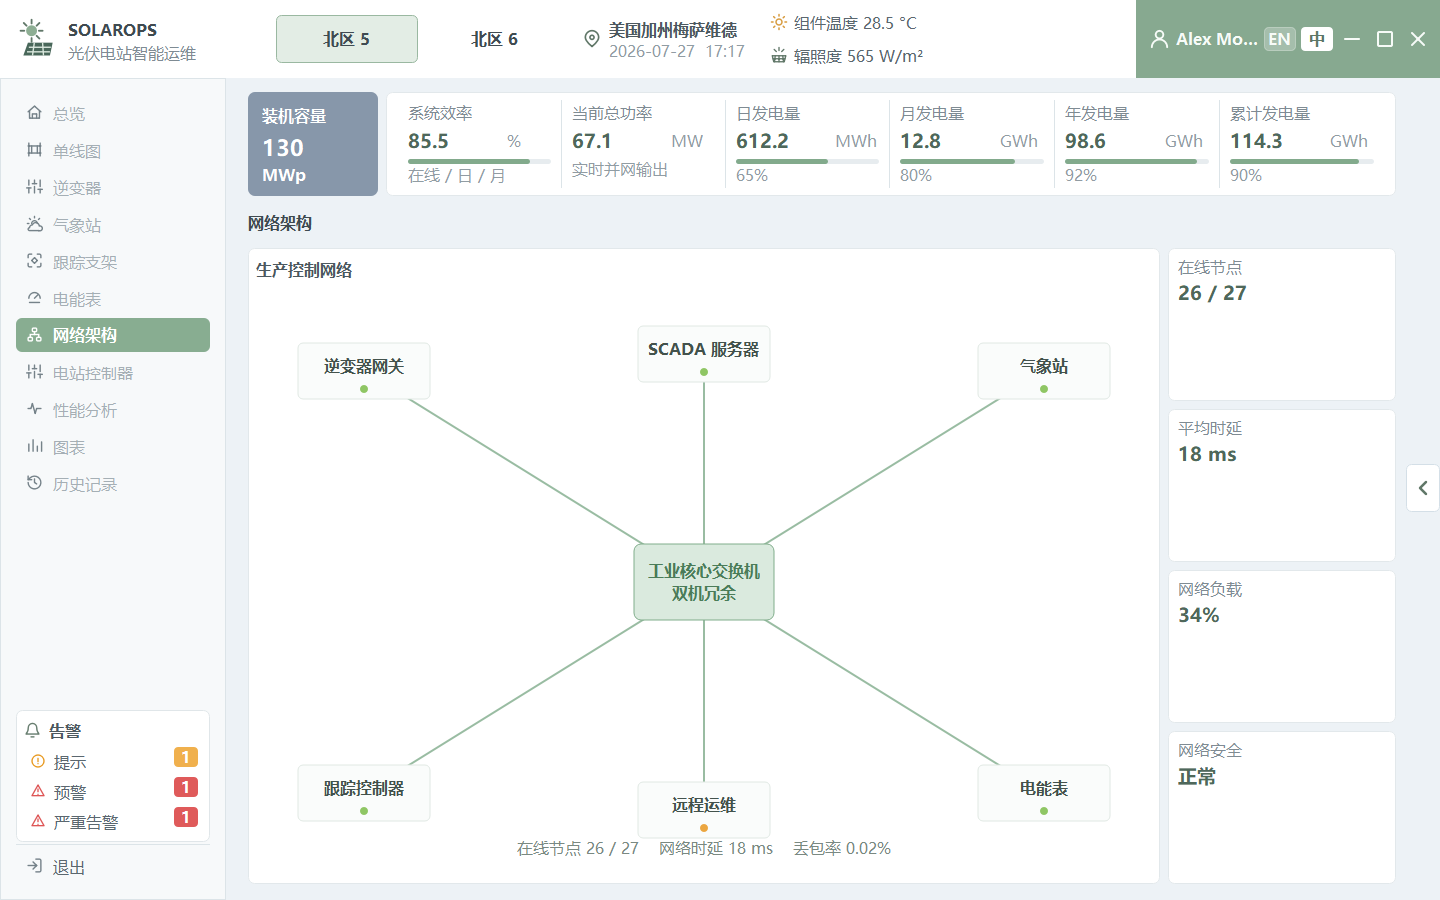
Network Architecture
Shows control layer, communication links, acquisition devices, and network health for locating communication issues.
Interaction
Link and device states are distinguished with themed status colors.
Controls Used
UIGQContainer
UIGQLabel
UIGQImage
08
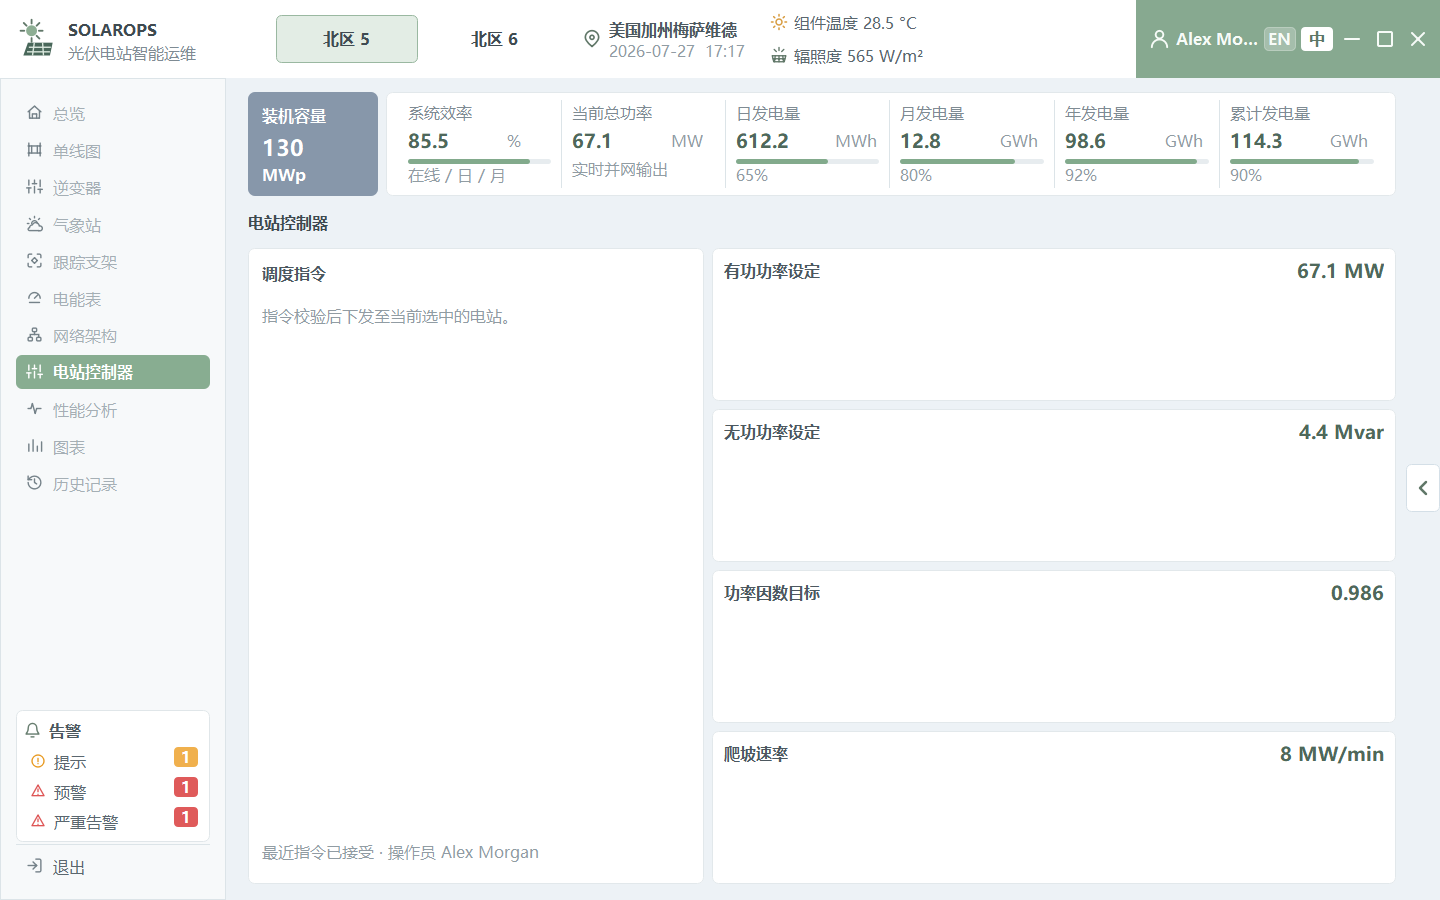
Plant Controller
Displays active/reactive power, control modes, and execution states to demonstrate controller workflow presentation.
Interaction
Switch control, command state, and parameter cards form the control panel.
Controls Used
UIGQContainer
UIGQLabel
SolarToggleSwitch
UIGQProgressBar
09
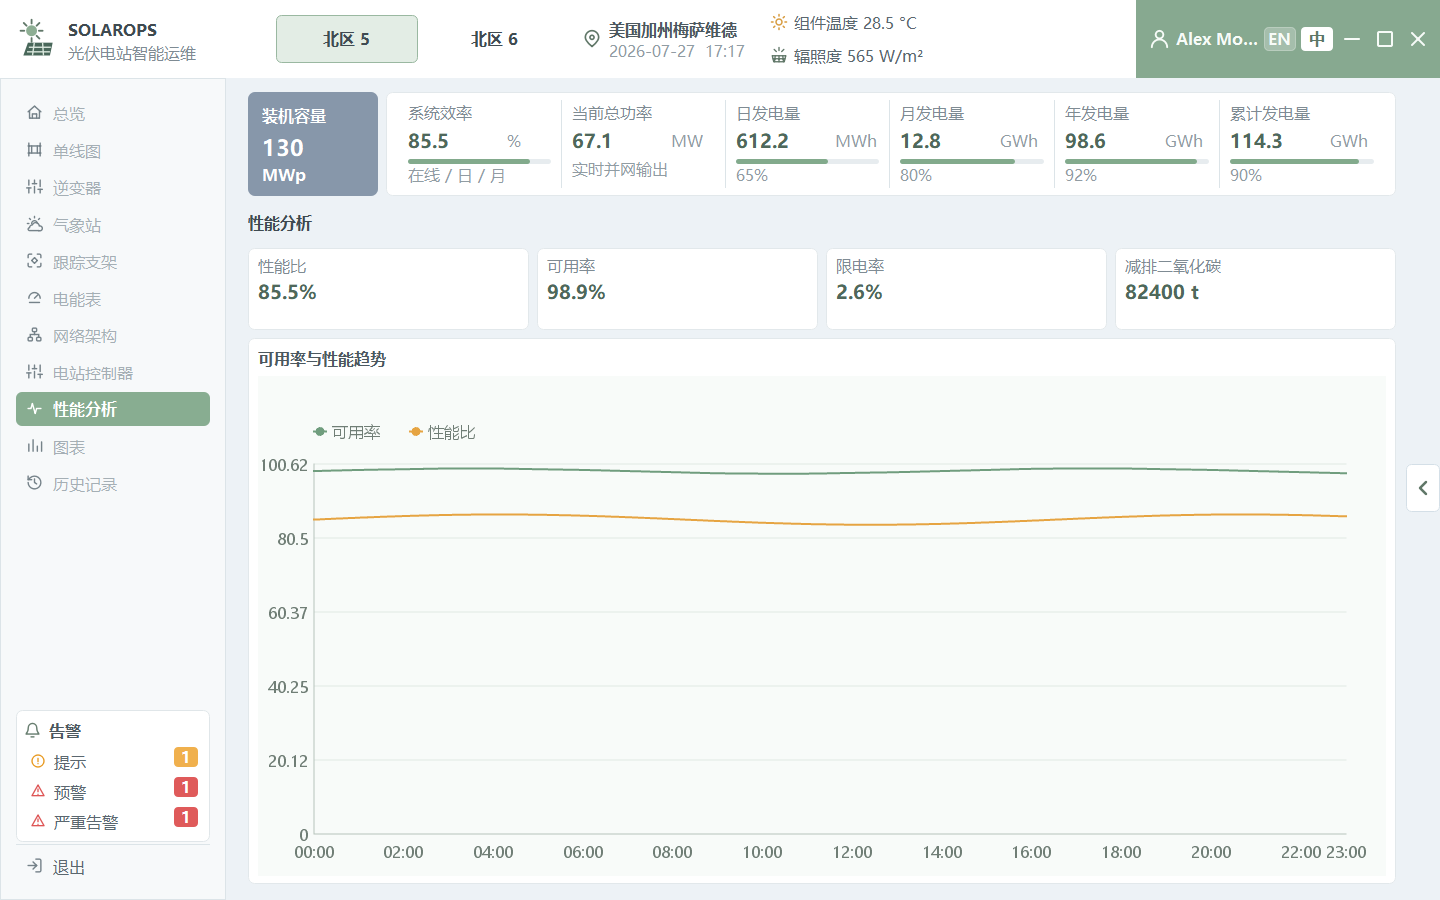
Performance Analysis
Analyzes PR, availability, equivalent hours, and related indicators to locate generation losses.
Interaction
Multiple KPI cards and charts work together.
Controls Used
UIGQContainer
UIGQLabel
UIGQLineChart
UIGQBarChart
10
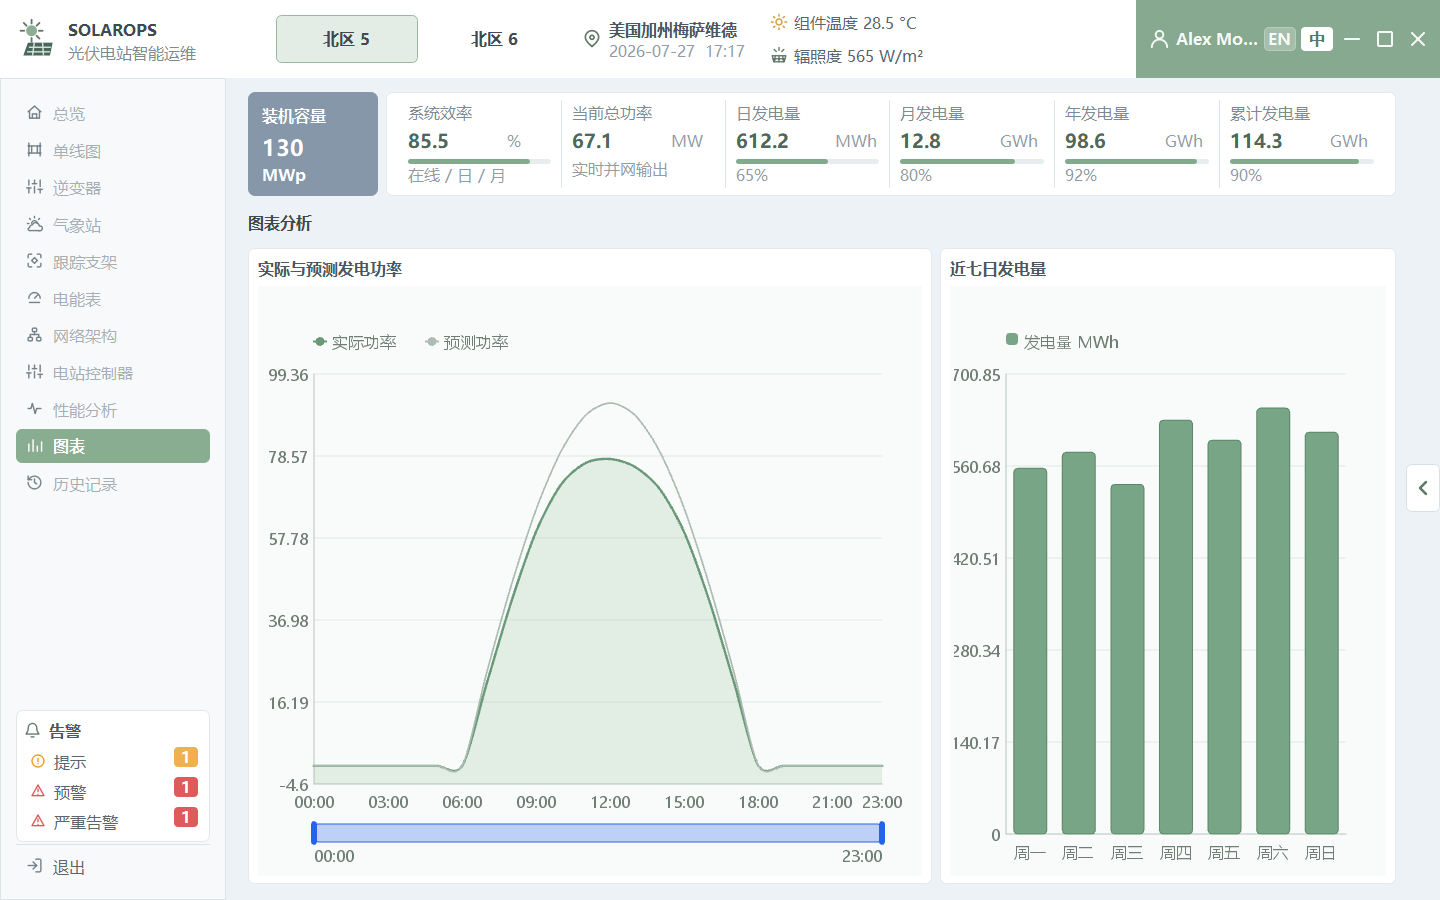
Charts
Demonstrates power curves, energy bars, and forecast trends to show combined ChartKit usage in monitoring pages.
Interaction
Charts support theme styling, legends, tooltips, and hover inspection.
Controls Used
UIGQLineChart
UIGQBarChart
UIGQChartTooltip
11
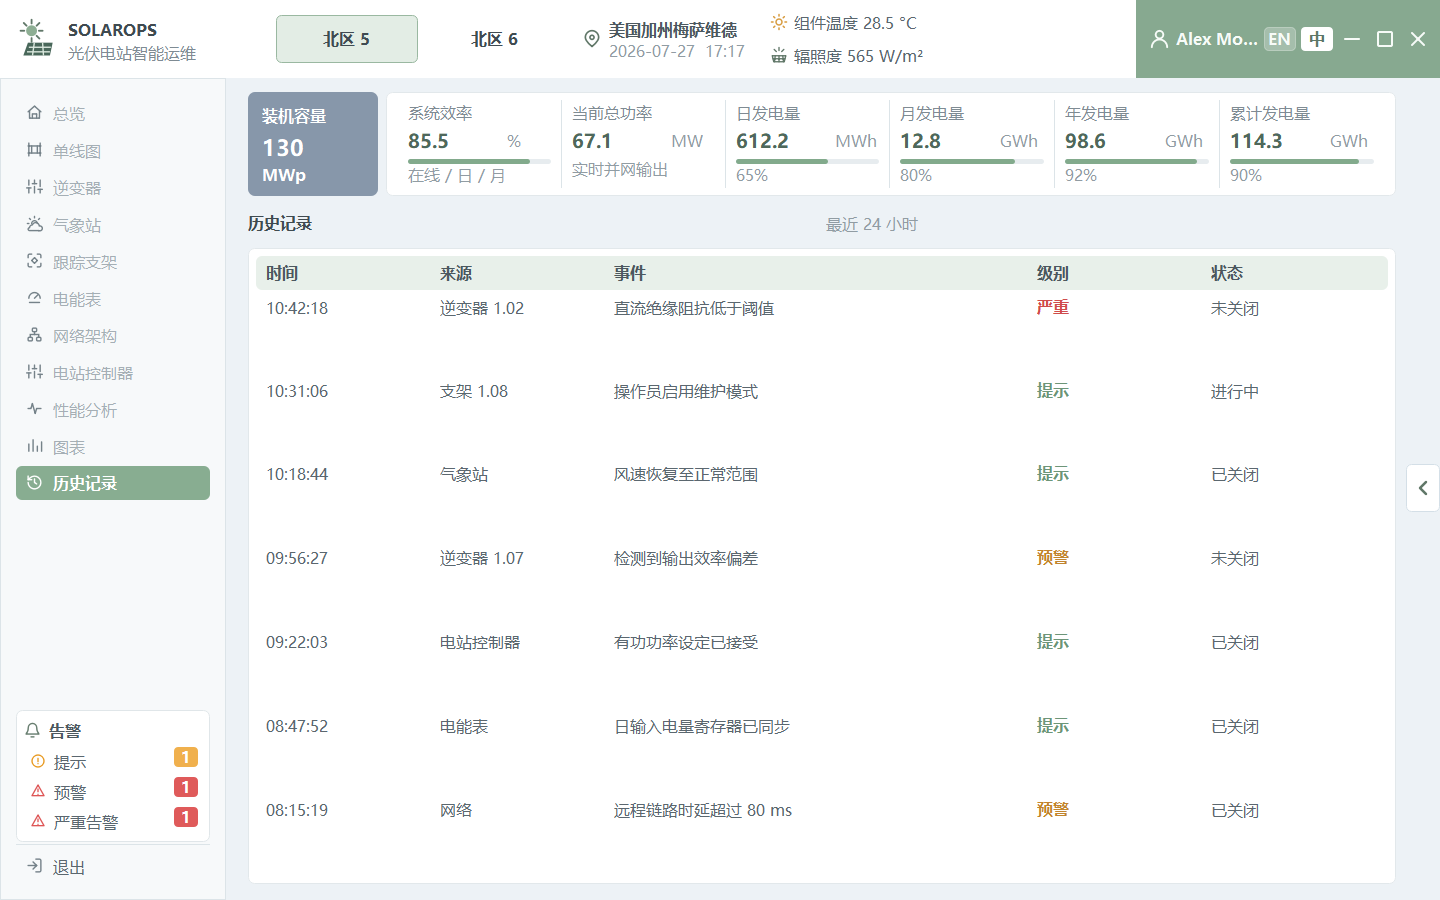
Event History
Shows device events, alarm recovery, and operation records for traceable plant operation.
Interaction
Event list refreshes with filter state.
Controls Used
UIGQContainer
UIGQLabel
UIGQPushButton