Back to Product Cases Case Showcase / Renewable Energy / Wind SCADA

WindOps Wind Farm Monitoring

A wind-farm demo for operations overview, turbine filtering, status sorting, maintenance drawer, and power trends.

WindOps wind farm monitoring demo screenshot
Case Overview

From Qt Components to a Complete Product Workspace

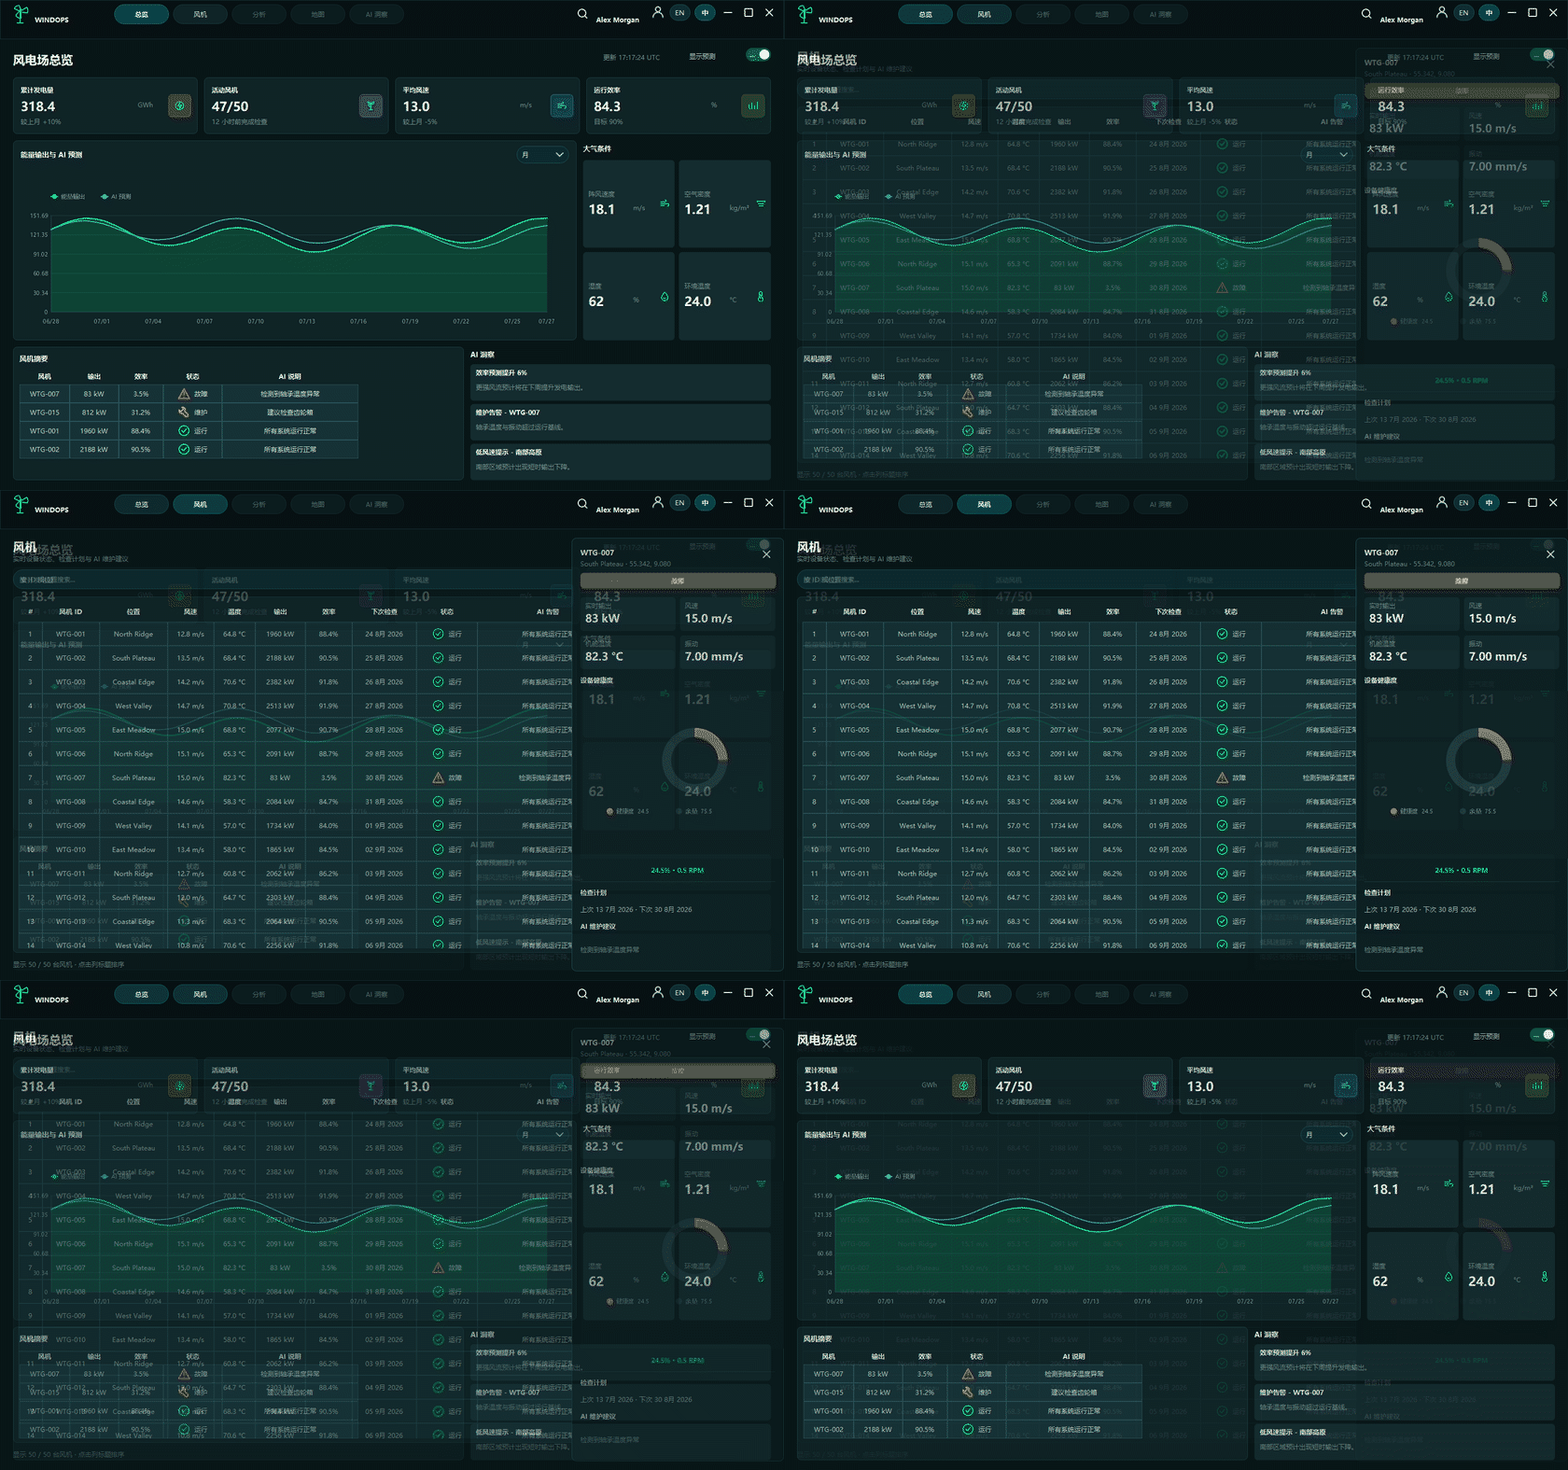
WindOps presents turbine fleet operation through a dark operations dashboard that combines KPIs, table filtering, trend curves, and a detail drawer.

Two-page structure for farm overview and turbine list
Supports filtering, sorting, and maintenance detail drawer
Displays linked power, efficiency, and forecast curves
Screens and Features

Case Page Showcase

Each section maps to a real demo screen and lists its purpose, main interactions, and Qt-UI controls.

Farm Overview - WindOps Wind Farm Monitoring
01

Farm Overview

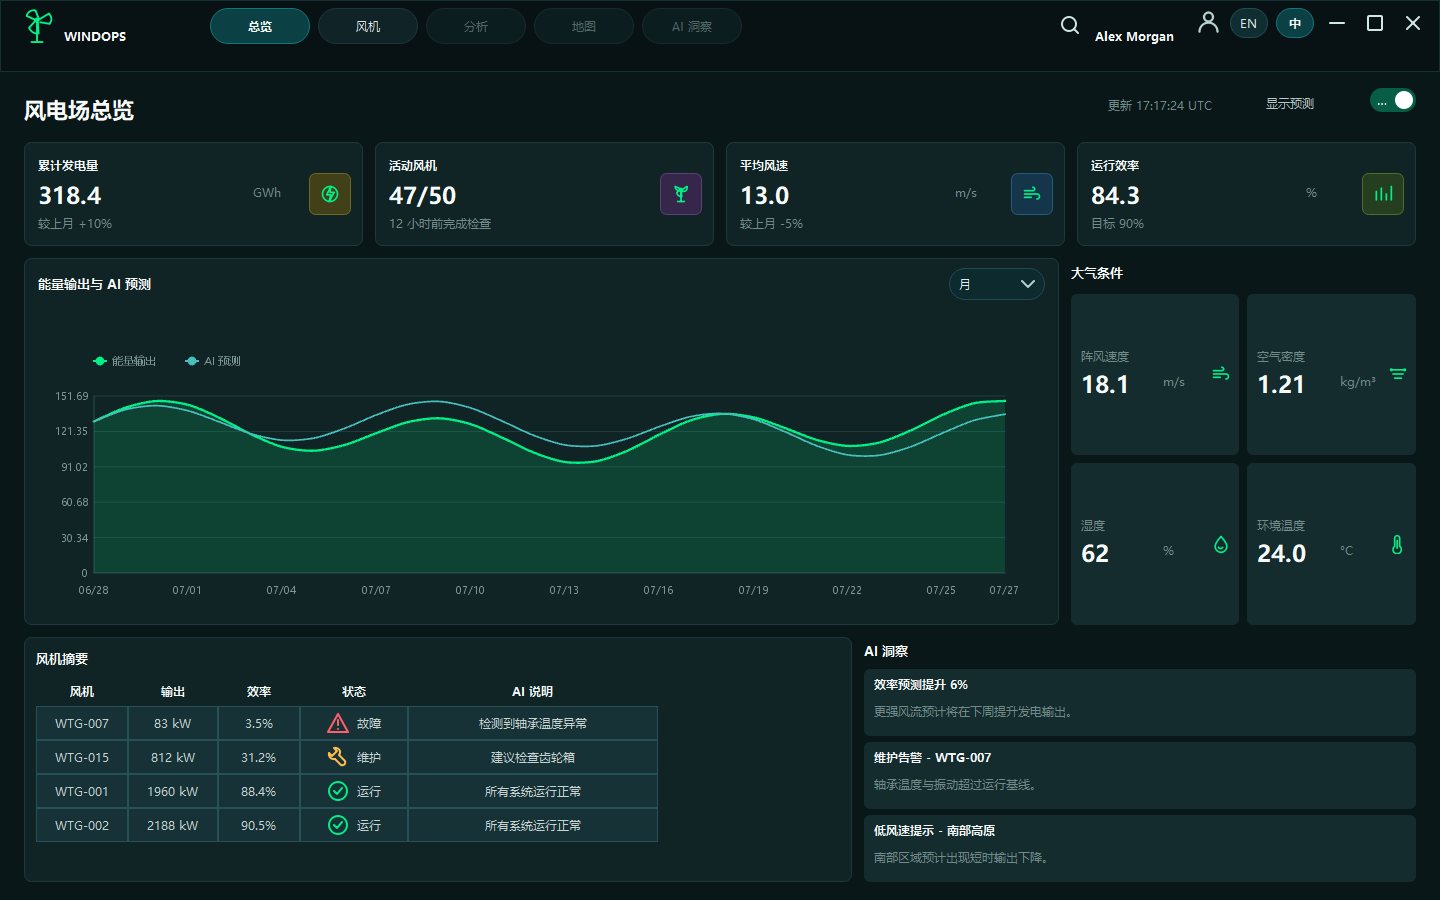
Shows turbine count, current power, average wind speed, availability, abnormal devices, and power trend for quick operation checks.

Interaction
KPIs, alarm entry points, and trend charts refresh with simulated data.
Controls Used
UIGQWindow UIGQContainer UIGQLabel UIGQPushButton UIGQLineChart UIGQBarChart
Turbine List and Detail - WindOps Wind Farm Monitoring
02

Turbine List and Detail

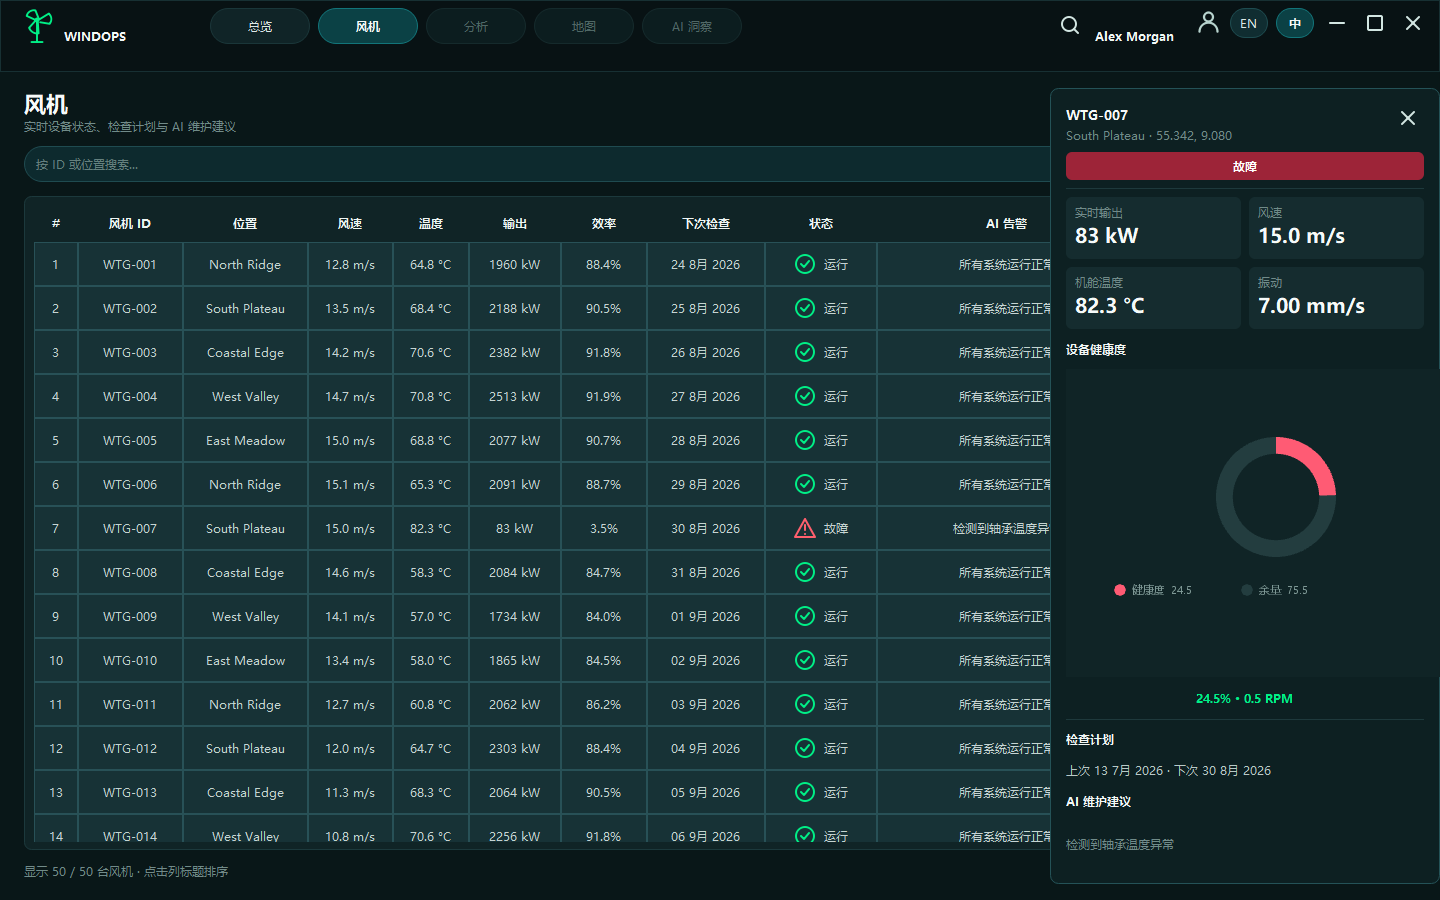
Manages 50 turbines in a dense table with status, area, and keyword filters plus a right-side maintenance drawer.

Interaction
Table selection, combined filters, detail expansion, and local turbine creation.
Controls Used
UIGQTableView UIGQComboBox UIGQLineEdit UIGQPushButton UIGQContainer